
The Market Profile RenderableSeries
New to SciChart WPF v5!
The FastMarketProfilerRenderableSeries and FastHistobarsRenderableSeries allow you to place a a histogram vertically besides candlesticks, as well as visualize trading data in a Market Profile. This type of chart can be used to visualize Trading Volume at various price levels.
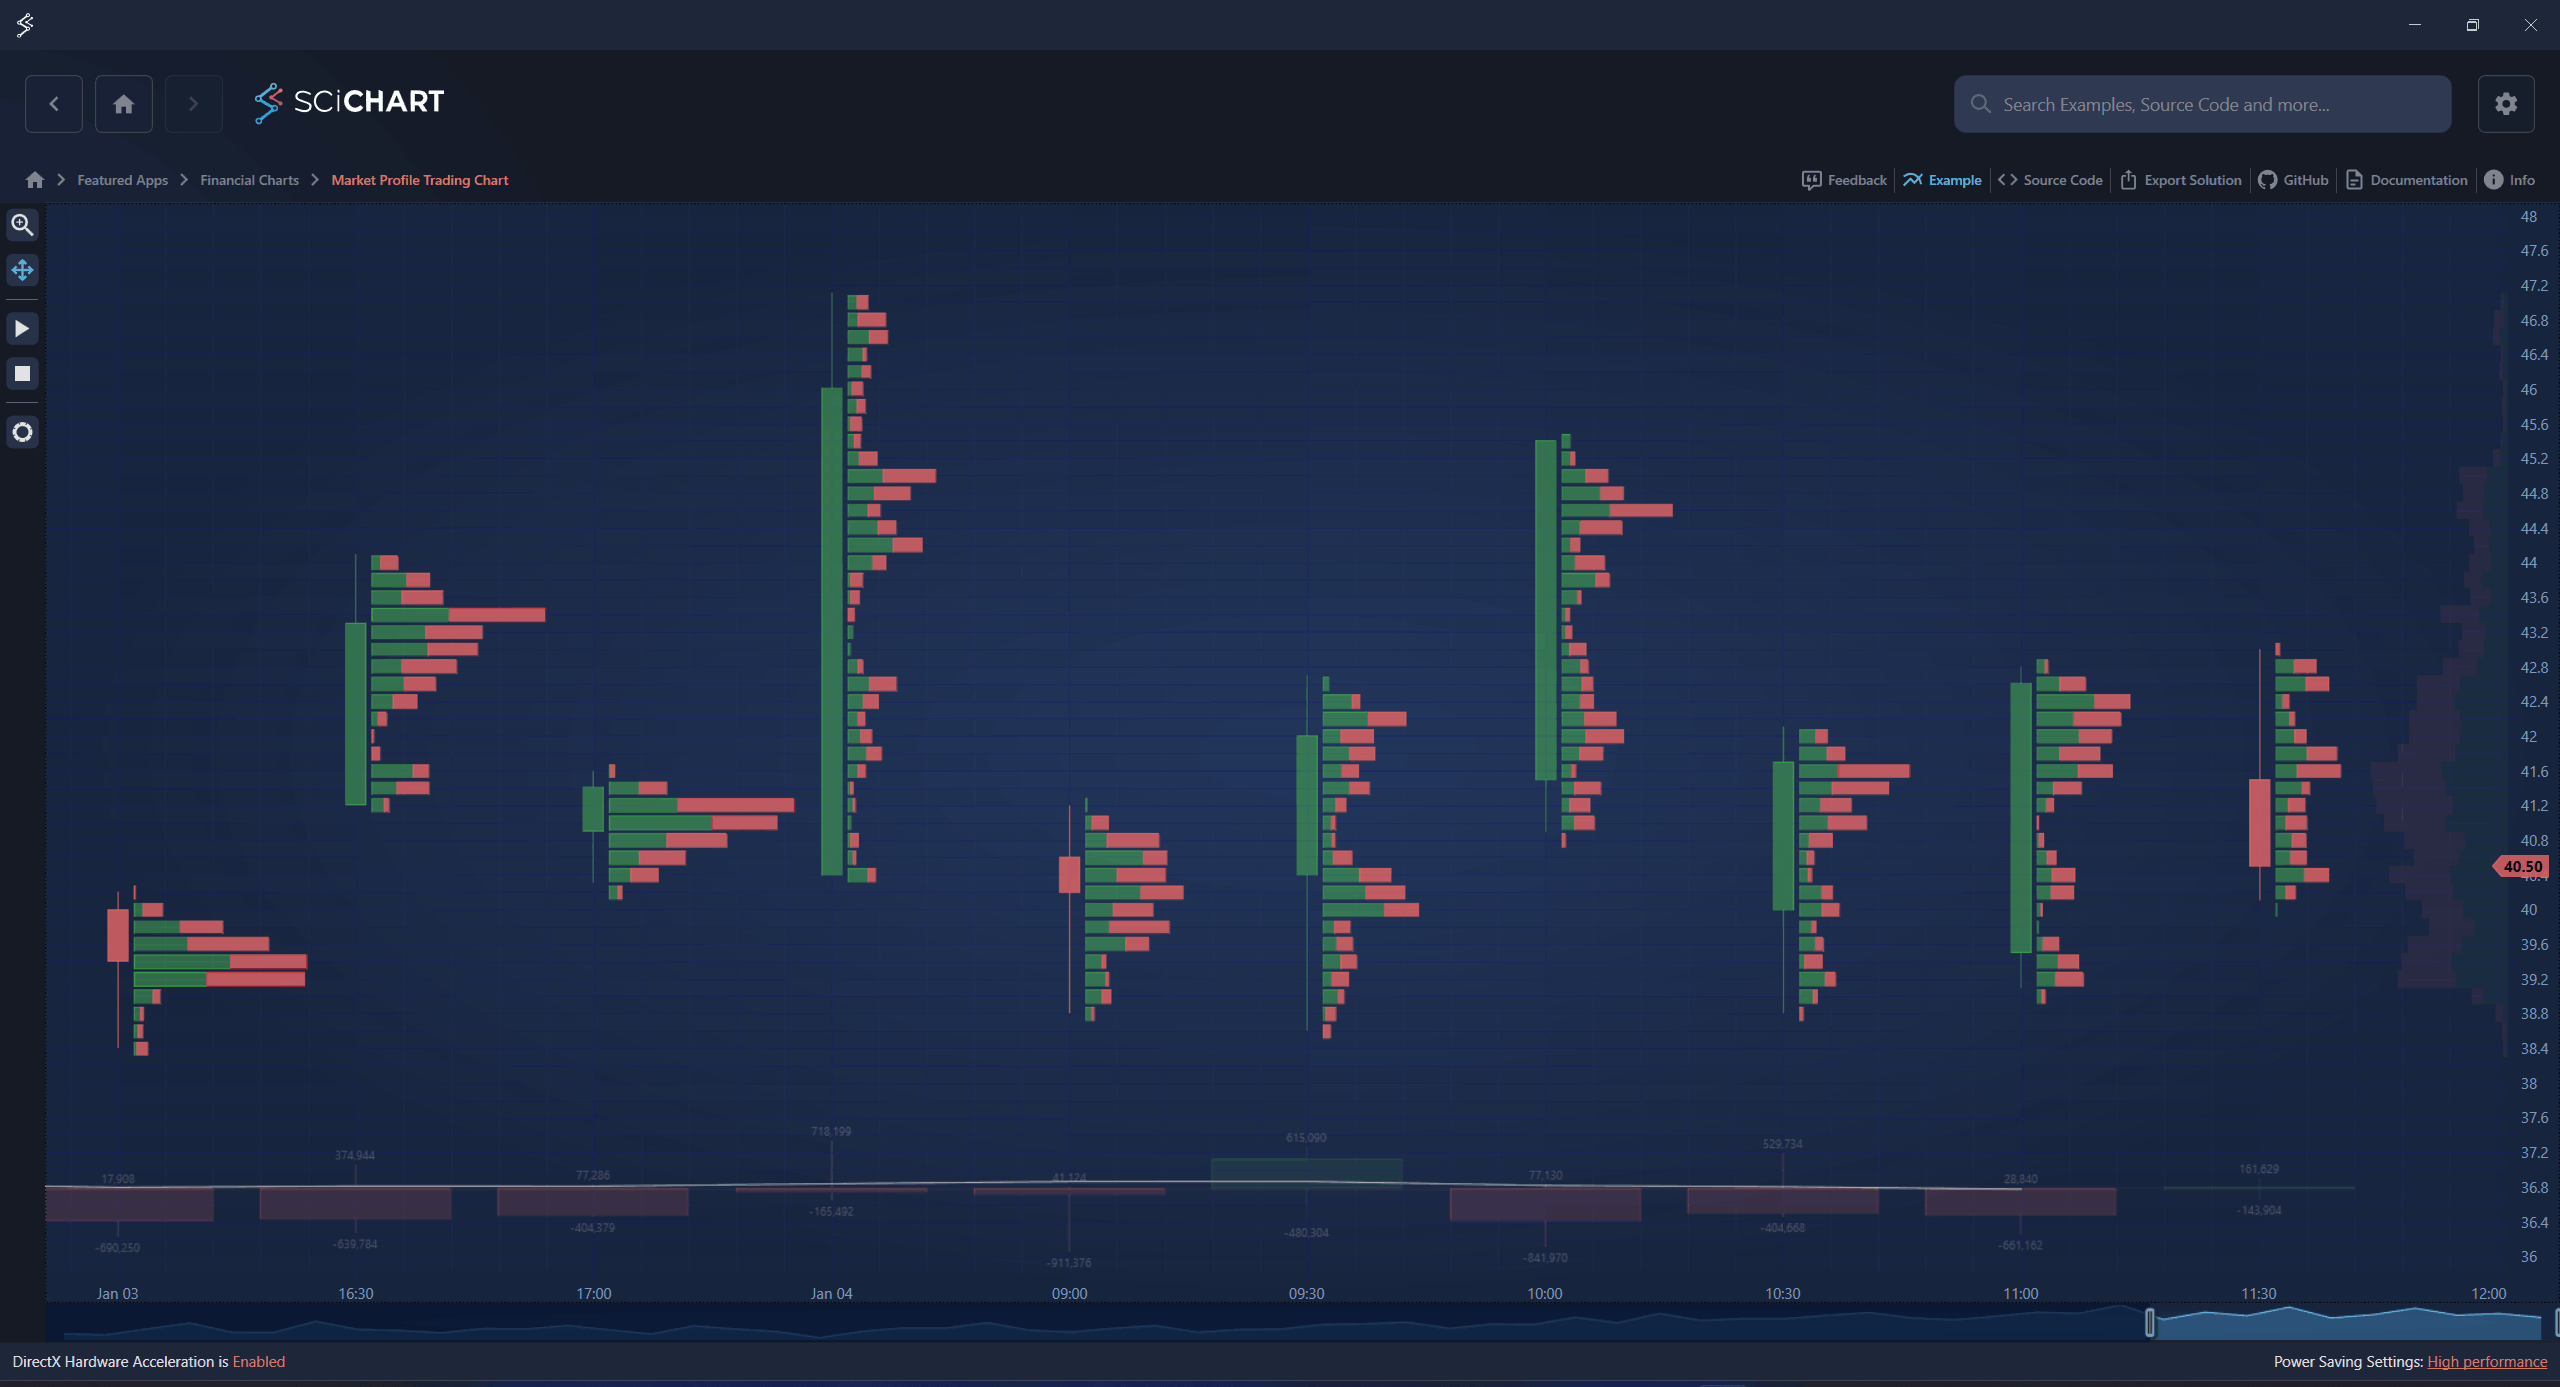
Declaring a Market Profile series
In the SciChart WPF Examples Suite we have a full example how to declare the above series types.
You can also download the source code for this example from our GitHub repository here: